Description

Gary Dayton – Primary Language of Market
Original Price: $259
You Just Pay: $29.95(One Time 88% OFF)
Author: Gary Dayton
Sale Page:_https://tradingpsychologyedge.com
Product Delivery : You will receive a receipt with download link through email.
Contact me for the proof and payment detail: email_Ebusinesstores@gmail.com Or Skype_Macbus87
Recordings of over 5 hours of teaching are available!

It’s not a lost art, yet!
Imagine being able to look at a chart and immediately understand the buying and selling? What would it be like to understand how the market was moving through each price bar and its associated volume? How would you feel if you knew the right time to buy the market on a pullback or sell as price rejects higher levels?
All of this is very possible.
Indicators, specialty software, and systems can be helpful, but they also can be confusing – often advising the traders to buy when the market is about to sell off or sell when the market is ready to rally. Successful traders use indicators as a backup to the chart’s price action. They understand that using indicators alone cannot get them very far. To achieve higher levels of trading, traders come to realize that they need to know how to read the price bars and volume independently of their indicators. Struggling traders do just the opposite: they rely on indicators and ignore what can be plainly read in the naked chart. To truly learn how to trade profitably, traders need to understand how to read the market by its own action bar-by-bar. This is what we teach you.
It’s definitely not a lost art!
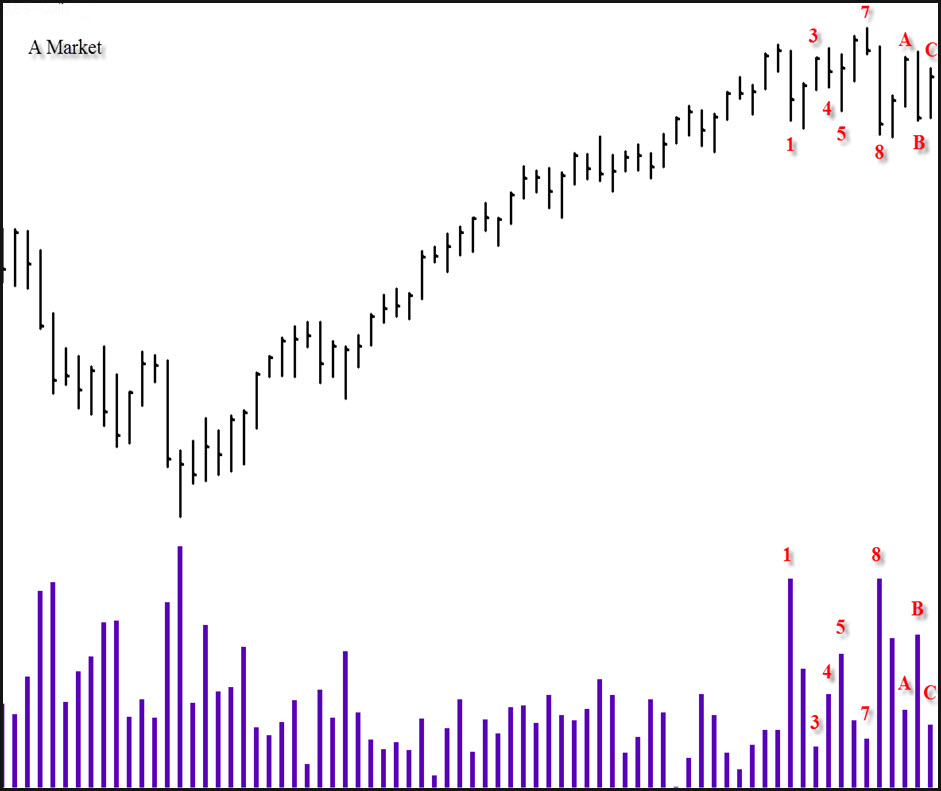
Here is a chart giving clear signs no indicator picked up. Can you tell what it is about to do?
 |
For those who could read the chart, the implications were clear. Every bar marked from 1-8 and A, B, C told a story about the next market move.Can you read these bars and their accompanying volume? |
Our Unique Approach
Few teach this sound approach like we do. Our approach is sincere and straight forward. You will come away with a new understanding of how to read a chart. Please note carefully: You will certainlyneed to practice the method – nothing in trading or life comes without some effort. But we have streamlined the material to help you advance as quickly as possible and if you do practice this, you will have a powerful way to trade any trading market.
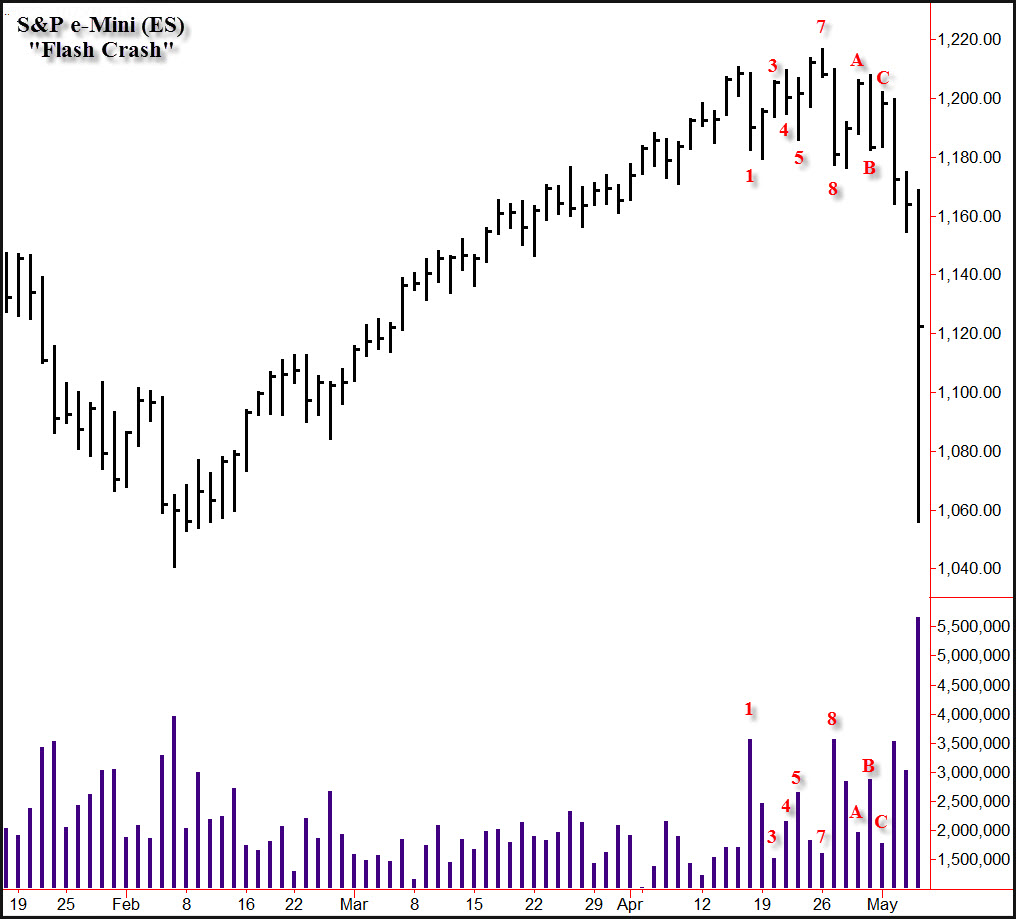
Can you see how important it is to be able to read bar-by-bar? Here’s what happened in the chart above.
What We Will Teach You
This special webinar will include:
- The intricacies of reading price bars and volume
- What wide spread bars mean
- The implications of high volume (there are several to be aware of)
- The implications of low volume (there are several to be aware of)
- The market contexts in which narrow range bars are important
- What to look for, bar-by-bar, in trending markets—both up and down trends
- One key indication in price and volume that gives a very strong indication that a trend is over
- Important market cues to pay attention to that signal a trend is likely
- Confirming indications that a trend remains intact and that you shouldn’t exit a winning trade prematurely – these are usually very clear and will help keep you in the trade
- Early warning signs that signal a trend is likely coming to an end – these tell you it is time to lighten up on your position or exit entirely
- Using market waves along with bar-by-bar analysis—a critical chart reading skill
- Exclusive: How to apply the Weis Wave with bar-by-bar trading!
- How to tell the difference between a normal pullback and a trend change
- Using price bars and volume for entries – we will go over several
- Where to set stops based on price and volume
- How to integrate higher time frames on a bar-by-bar basis for very powerful trading
- We will walk-forward a few markets bar-by-bar to give you a feel of reading the market real-time.
- And more.
We don’t do “quick & dirty”
 |
Charts are dissected in great detail. It is not good enough to just look at a chart in a casual manner. We show you how to go right into the heart of bar-by-bar analysis. |
As with everything we teach, the material you will learn in this webinar applies to all freely traded markets in all time frames. We have never done this before and have never shown this material in this depth before, so you will be getting it first! This course is helpful for traders whether you are new to the market or have been trading for a while.
This course is composed of 2 sessons of more than 5 hours of teaching. Sessions are recorded and you can review the recordings at your convenience.
Paul, United States
Tang from Malaysia


Reviews
There are no reviews yet.